14 gorgeous javascript chart resources and plugins
by aoaob on 2009-06-11 09:56:49
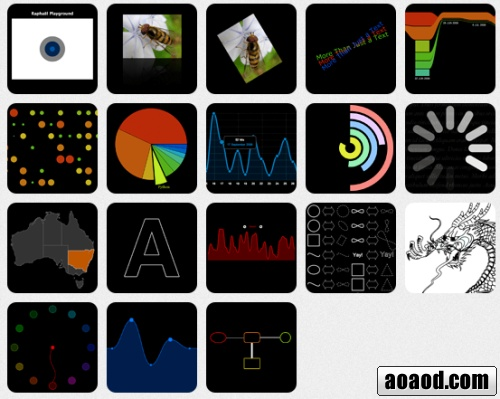
I've been sharing a lot of useful css/jquery resources recently, and here I'm going to cover some javascript resources and plugins for building gorgeous diagrams that are the most efficient way to present data.
There are many different ways to create a chart, such as falsh, javascript, css, or some server-side languages php, asp, etc. The following chart is implemented through javascript.